


For over a century, the Scripps Pier in La Jolla has stood as a silent witness to profound changes in our planet’s oceans. Every day, a ritual that began in 1916 continues uninterrupted—scientists carefully lower a small container through a designated hole at the end of the nearly 1,100-foot pier. From the ocean’s depths, they collect water samples to measure two key variables: temperature and salinity. These seemingly simple daily measurements hold the key to understanding how our climate is changing.
Melissa Carter, a researcher at the renowned Scripps Institution of Oceanography, explains the value of this long-standing practice: “We’re hand-collecting a sample from the ocean and measuring it for temperature and salinity.” Though the process may appear routine, it is part of the longest continuous oceanographic data record in the Pacific Ocean—an invaluable resource for tracking long-term trends in ocean conditions.
What makes this data so unique is its consistency. Since 1916, the method for sample collection has remained unchanged. Carter emphasizes that by maintaining the same methods used in the past, researchers are able to accurately track and understand long-term trends over time. This consistent methodology makes the Scripps Pier dataset one of the most reliable indicators of long-term oceanic changes, positioning it as a crucial source for understanding broader environmental shifts.
The data collected over the past century paints a clear picture of significant changes in ocean temperature and chemistry. In particular, the data reveals a notable warming trend that began in the 1980s. “We’ve seen that the ocean is warming, and it’s warming at almost three degrees Fahrenheit over 100 years,” Carter states.
A few degrees of ocean warming may seem minor, but the implications are far-reaching. One of the most direct consequences is sea-level rise. As water warms, it expands, pushing shorelines farther inland and causing erosion. Coastal communities around the world are already feeling the effects of this encroaching threat.
Moreover, warmer ocean temperatures provide more energy for tropical storms, enabling them to grow stronger and more rapidly. This phenomenon was exemplified by Hurricane Milton, which intensified at a record-breaking rate in the Gulf of Mexico, fueled by unusually warm waters. Following closely on its heels, Hurricane Helene went on to become one of the deadliest storms in U.S. history. These are not isolated incidents but part of a worrying pattern, highlighting the increasing power of tropical storms in a warming climate.
In addition, warming oceans are associated with the increased frequency of El Niño events. Historically, El Niño winters occurred every five to seven years. However, recent data suggest that these cycles are now happening more frequently, every three to five years. This shift in frequency can dramatically impact global weather patterns. In California, for example, last winter’s El Niño resulted in record-breaking rainfall, including a storm on January 22 that delivered nearly three inches of rain to San Diego in just three hours—about a quarter of the city’s typical annual precipitation.
These trends underscore the importance of the data being gathered at Scripps Pier and similar shore stations along the California coast. Carter explains, “During El Niño years, we often observe an increase in the influx of saltier water.” “So, knowing the temperature, the salinity, and the nutrients can really help put that signal together.”
The Scripps Pier is one of 10 shore stations along the California coastline participating in this ongoing monitoring project. While some stations have a continuous data record that spans over a century, others have been operating for a few decades. Yet, all show the same concerning trend: warmer water temperatures. Carter explains that understanding the full scope of what’s happening along our coast requires not only the data from this station but also contributions from many others and larger datasets to create a more comprehensive picture.
The value of this project cannot be overstated. By examining data from multiple locations and comparing trends across decades, researchers can gain deeper insights into how climate change is affecting our oceans and, by extension, our weather patterns, coastlines, and ecosystems.
In an exciting development, the Scripps Institution of Oceanography recently installed a live underwater camera at the pier. This addition allows the public to witness the daily work of these scientists and the underwater world they study in real-time. You can view the underwater camera feed here and see firsthand the very environment that is being so diligently monitored.
As we continue to face the global challenge of climate change, the Scripps Pier remains a beacon of scientific continuity. Its century-long record of oceanic data serves as a crucial tool in understanding the changes taking place in our world, offering valuable insights for future generations. The daily measurements collected here may seem modest, but they are pieces of a much larger puzzle—one that could hold the answers to some of the most pressing environmental questions of our time.
100 Years of Ocean Research Explains Rising Seas and Storms
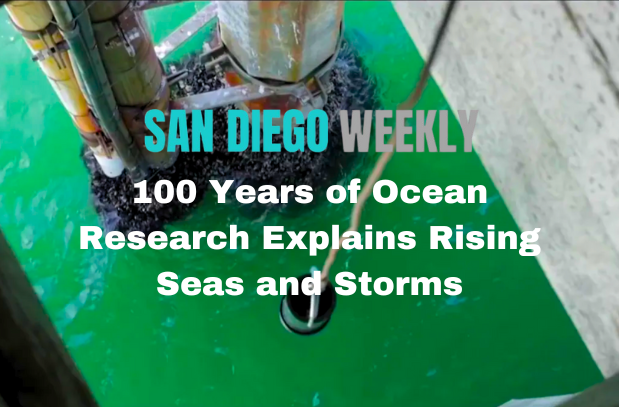
100 years of research at Scripps Pier helps explain our changing climate